Monitoring Azure Service Bus (SB) comes with its own set of challenges, primarily due to the distributed nature of the service and the complexities involved in message processing and delivery. Some of the most common challenges associated with monitoring Azure SB include:
Message Flow Monitoring: Tracking the flow of messages through various queues or topics, including understanding where bottlenecks might occur or where messages might be delayed.
Latency Monitoring: Ensuring that messages are being processed within acceptable time frames. Monitoring latency helps in identifying performance issues within the system.
Error Handling and Dead Letter Queue Monitoring: Monitoring for exceptions and errors that occur during message processing and ensuring that messages are appropriately handled, including being moved to dead letter queues when necessary.
Scaling Challenges: As the workload increases or decreases, dynamically scaling the Azure SB resources to meet demand while maintaining performance and cost-effectiveness can be challenging. Monitoring resource usage and performance metrics becomes crucial in such scenarios.
Resource Utilization Monitoring: Monitoring the utilization of Azure SB resources such as queues, topics, and subscriptions to ensure optimal resource allocation and to avoid hitting any service limits.
Message Loss and Duplication Detection: Detecting and mitigating message loss or duplication scenarios, which can occur due to network issues, application errors, or transient failures.
Cross-Component Monitoring: Often, Azure SB is just one component in a larger application architecture. Monitoring interactions between Azure SB and other components (e.g., Azure Functions, Azure Logic Apps, databases) to ensure end-to-end reliability and performance is another challenge.
Custom Metrics and Alerts: Tailoring monitoring solutions to capture custom metrics specific to your application’s requirements and setting up alerts to notify administrators about critical events or performance issues.
To address these challenges, Azure provides various monitoring and diagnostics tools such as Azure Monitor, Azure Service Bus Metrics, Application Insights, and Azure Monitor Logs, which can be used to collect and analyze telemetry data from Azure SB and other related resources. While Azure provides these tools, many organizations find themselves needing to monitor Azure SB in addition to existing messaging technologies like MQ or Rabbit MQ. To overcome these challenges, organizations utilize Azure Monitor as part of an overall observability solution. This typically includes capabilities like;
- Tracking of the elapsed time of each message flow, event counts and the timings of each event while keeping track of workflow SLA criteria performance and visualizing workflow performance over time in graphical charts
- Graphical editor to create monitoring policies with no scripting or programming required which can create alerts based on derived metrics from analytics, wild cards or regular expressions
- Policy based, real time monitoring combined with role-based access and full auditability of that access
- The ability to know when latency is occurring or is about to occur because of AI/ML based metric scoring that predicts when latency and bottlenecks will occur
Companies that have employed these capabilities have found observability for Azure SB and existing messaging technologies to be much more effective and efficient.
Contact us to learn more about what meshIQ can offer you, or request a demo with one of our meshIQ experts.
In the ever-evolving landscape of financial services, institutions are under constant pressure to ensure their messaging infrastructures comply with a myriad of global regulatory requirements. Compliance with regulations such as the General Data Protection Regulation (GDPR), the Payment Services Directive 2 (PSD2), and other localized financial regulations is not just a legal necessity but a cornerstone for maintaining trust and integrity in the financial sector. This article provides guidance on how financial institutions can navigate these complexities, focusing on transaction tracking, messaging infrastructure observability, financial messaging compliance, and DevOps compliance.
1. Understanding the Regulatory Landscape
Before diving into compliance strategies, it’s crucial to have a comprehensive understanding of the regulatory landscape. Regulations like GDPR focus on data protection and privacy, while PSD2 is aimed at increasing competition and innovation in the European payment market. Each regulation has specific requirements for messaging and transaction tracking, mandating financial institutions to maintain a high level of transparency and security.
2. Transaction Tracking
Transaction tracking is essential for financial messaging compliance. It involves monitoring and recording every transaction that flows through the messaging infrastructure. This capability ensures that financial institutions can audit transactions, resolve disputes, and comply with legal and regulatory requirements. By leveraging meshIQ’s tracking capabilities, institutions can benefit from a comprehensive and robust message, event, and middleware tracking. This includes AI/ML and AIOps features that help with predictive analysis and preventing future bottlenecks/inefficiencies, ensuring compliance with regulatory standards.
3. Enhancing Messaging Infrastructure Observability
Messaging infrastructure observability is critical for understanding the health, performance, and reliability of financial messaging systems. It goes beyond traditional monitoring by providing insights into the internal state of systems via logs, metrics, and traces. meshIQ’s observability capabilities allow financial institutions to gain full visibility into their messaging infrastructure, ensuring that any potential compliance issues can be identified and addressed proactively. This level of observability is paramount for maintaining system integrity and compliance with global financial regulations.
4. Ensuring DevOps Compliance
In a DevOps environment, where rapid development and deployment are the norms, maintaining compliance can be challenging. Financial institutions must ensure that their continuous integration and continuous deployment (CI/CD) pipelines adhere to regulatory requirements. This includes implementing role-based access control, maintaining audit trails, and ensuring that all changes to the messaging infrastructure are compliant with relevant regulations. meshIQ’s compliant self-service option allows for role-based access for DevOps team members, streamlining CI/CD processes while remaining compliant.
5. Adopting a Proactive Compliance Posture
Adopting a proactive compliance posture involves anticipating changes in the regulatory environment and adjusting practices accordingly. This includes regular audits of messaging infrastructure, ongoing staff training on compliance matters, and the implementation of scalable solutions that can adapt to new regulations. Financial institutions should leverage platforms like meshIQ that offer comprehensive capabilities in tracking, observability, and management, ensuring that compliance is maintained as regulations evolve.
Conclusion
Ensuring compliance in financial messaging is a complex but manageable task. By focusing on transaction tracking, enhancing observability, ensuring DevOps compliance, and adopting a proactive compliance posture, financial institutions can navigate the regulatory landscape effectively. Leveraging advanced platforms like meshIQ not only aids in achieving compliance but also enhances operational efficiency, security, and reliability in the financial messaging infrastructure. In doing so, institutions can safeguard their reputation, avoid hefty fines, and, most importantly, maintain customer trust in an increasingly competitive and regulated market.
Join us for our monthly Tech Talk Webinar series to learn more about our platform or contact us for a demo.
In today’s digital landscape, the performance and reliability of messaging systems are paramount for business operations. Systems like IBM MQ play a crucial role in ensuring seamless communication between different parts of an application, impacting everything from transaction processing to customer experiences. To optimize these systems, it’s essential to focus on robust monitoring, efficient troubleshooting, and effective tuning techniques. Here, we delve into best practices for enhancing the performance and reliability of messaging systems, with a spotlight on MQ observability, MQ monitoring, and MQ performance tracking.
Understanding MQ Observability
Observability in the context of MQ systems refers to the ability to gain insights into the system’s operations and performance through logging, monitoring, and tracing. It’s not just about watching what happens but being able to understand why something happened. Implementing comprehensive MQ observability involves:
Implementing Comprehensive Logging: Ensure that all critical message flows are logged with sufficient detail, enabling the identification of bottlenecks or failures.
Real-Time Monitoring: Utilize tools that offer real-time monitoring of queues, topics, and message flows to quickly identify and respond to issues.
Tracing Message Paths: Employ message tracking to follow the path of a message through the MQ system, helping to pinpoint failures or performance bottlenecks.
MQ Monitoring Best Practices
Effective MQ monitoring is critical for maintaining system health and performance. It involves:
Setting Up Alerts: Configure alerts for critical events or metrics that indicate problems, such as queue depths exceeding thresholds, message delivery delays, or system outages.
Utilizing MQ Performance Metrics: Monitor key performance indicators (KPIs), including message throughput, response times, and resource utilization, to identify trends and potential issues before they impact operations.
Role-Based Access for Monitoring: Implement role-based access controls to ensure that team members have the appropriate level of visibility into MQ operations, enhancing security without hindering operational efficiency.
Techniques for MQ Performance Tracking
To ensure your MQ system operates at peak efficiency, continuous performance tracking and tuning are necessary. This involves:
Analyzing Performance Over Time: Use historical data to identify trends, patterns, and anomalies in MQ performance. This analysis can help predict future issues and guide proactive tuning.
Optimizing Queue Management: Regularly review and adjust queue settings, such as maximum depth and priorities, to ensure efficient message processing. Implementing priority queuing can help in processing critical messages faster.
Tuning Channel Configurations: Channels should be configured and tuned based on the volume and nature of the traffic. Adjusting channel parameters like batch sizes and timeouts can significantly impact performance.
Troubleshooting Common MQ Issues
When issues arise, a systematic approach to troubleshooting can help quickly resolve problems:
Identify the Symptom: Start by clearly identifying the issue, whether it’s delayed message delivery, high system resource utilization, or message loss.
Analyze Logs and Metrics: Use the detailed logs and performance metrics to narrow down the potential causes of the issue.
Test and Validate: After identifying a potential solution, test it in a controlled environment before rolling it out to production to ensure it effectively resolves the issue without introducing new ones.
Conclusion
Optimizing the performance and reliability of MQ systems is an ongoing process that requires attention to detail, a deep understanding of the system’s inner workings, and a proactive approach to monitoring and maintenance. By implementing robust MQ observability, monitoring, and performance tracking practices, organizations can ensure their messaging systems are both efficient and resilient, supporting seamless business operations and delivering exceptional customer experiences.
Remember, the key to success lies in not just reacting to issues as they arise but in anticipating potential challenges and addressing them proactively. With the right strategies in place, your messaging system can become a cornerstone of your organization’s operational excellence.
Join us for our monthly Tech Talk Webinar series to learn more about our platform or contact us for a demo.
You probably have seen ads where someone claims that their app can save you money by finding subscriptions you forgot about. I have a hard time imaging someone with $100s of dollars of expenses they forgot about, but I have had the occasional one that was missed. The problem is that people are inefficient when it comes to managing “stuff”. That is why there are so many places to store “stuff”. That applies in our daily life where we have many things stored away in closets, here and there, and even in external storage spaces. We take pictures of everything and don’t often go back and clean them up. Our computers are full of documents and files that we’ve downloaded and who knows what. Why? Because getting rid of stuff is hard. But stuff is becoming increasingly important when dealing with cloud hosted services. Let me give you a couple more examples.
I recently did a Tech Talk Webinar on Kafka partitions. Not long thereafter I got a bill from my Confluent Cloud Kafka service. It reminded me that they bill by partition hour. That is each partition you define has a set charge whether you use it or not. Usage incurs additional charges. But it was just another reminder to me that you need to keep monitoring your usage and, in some cases, change behavior to accommodate what your costs may be.
Another case that I ran into was attending a training session for using Kafka on Confluent Cloud. As part of this, the trainer suggested that we set up a KSQL database. I set it up as required and it was pretty simple. At that point I kind of just forgot about it. However, that wasn’t the end of it. I was reviewing my billing statement for the month, and I noticed a charge I didn’t expect. On review, I found that it was for the KSQL. There is a small flat rate charge for it, so once I set it up, whether I used it or not, I still incurred a cost. I needed to go back and delete it and then the cost was reduced.
It is not just Confluent Cloud where something like this happens. Another time, one of our teams had wanted to try out Amazon MSK (their cloud instance of Kafka). While setting it up, they ran into some issues that they were unable to resolve and decided not to use MSK for their specific use case. However, similar to the scenario above, they did not delete the MSK instance that they had created. There was a charge for the servers and components that hosted this. Again, that was not found until the billing statement arrived and someone questioned why there was a charge for MSK.
While the examples I have used above were testing scenarios, the same applies to production applications. They have a lifecycle on how they’re used. For example, the application may start off with limited usage, and then may consume more resources as it increases in popularity. Then, at some point, it could become obsolete and still have resources allocated that are no longer being used. Production applications typically are using more expensive resources.
While cloud instances are convenient, they also demand more attention. Something as small as 25 cents an hour may not sound like much but over a period of a year is over $2000. Some cloud services are obviously much more expensive than that, and different cloud services charge for different components. Some may charge for the servers or the resources they consume, or the number of objects defined and so on. It is very important to know the basis on which your cloud services are billed. Even something as small as a half cent per hour adds up quickly with Kafka partitions when you have many of them for a single topic.
While not the typical use case associated with observability, it is related. You need to be able to see what is going on, what is defined, and how it is used over time. The meshIQ platform is very well suited for this as we can observe what is defined and how it is used, manage those definitions to ensure that they are needed, and correct, and track the application usage to determine which applications are using the most resources.
Join us for our monthly Tech Talk Webinar series to learn more about our platform or contact us for a demo.
There was a time not too long ago, before the cloud was a part of every enterprise technology conversation, when integration work was considered the purview of a specific architecture and engineering group.
If messages failed to send, or services failed to respond, application stakeholders would create a trouble ticket for the integration team to address.
In some ways, this separation of labor was effective enough at the time. There were a finite number of point-to-point integrations between systems, and most request/response traffic would flow through an integration backbone, such as an ESB or MQ server.
Even if a developer did some of the adaptation work in their own code, when their applications would be promoted, it would be standard practice to hand over the specifications and allow integration teams to manage how the transactions would play out, with jobs and traffic scheduling to hopefully avoid bottlenecks.
Whenever a blockage did occur, integration engineers would be first on the scene, because they were the most familiar with how their team set up each adapter and data transformation step branching off of that message bus.
In the modern application world, integration has become way too complex to be the purview of one group, or even one huge department, as our applications now surf on an ever-changing sea of services and hybrid IT architecture that is connected to partners, and the world at large.
Covering complexity with MESH
The software development community at large constantly invents new ways to bridge the divide between message queues and point-to-point integrations in order to talk to disparate systems. There were web services and SOA, then various shades of integration fabrics, and then containers and service meshes as today’s cloud native architectures evolved.
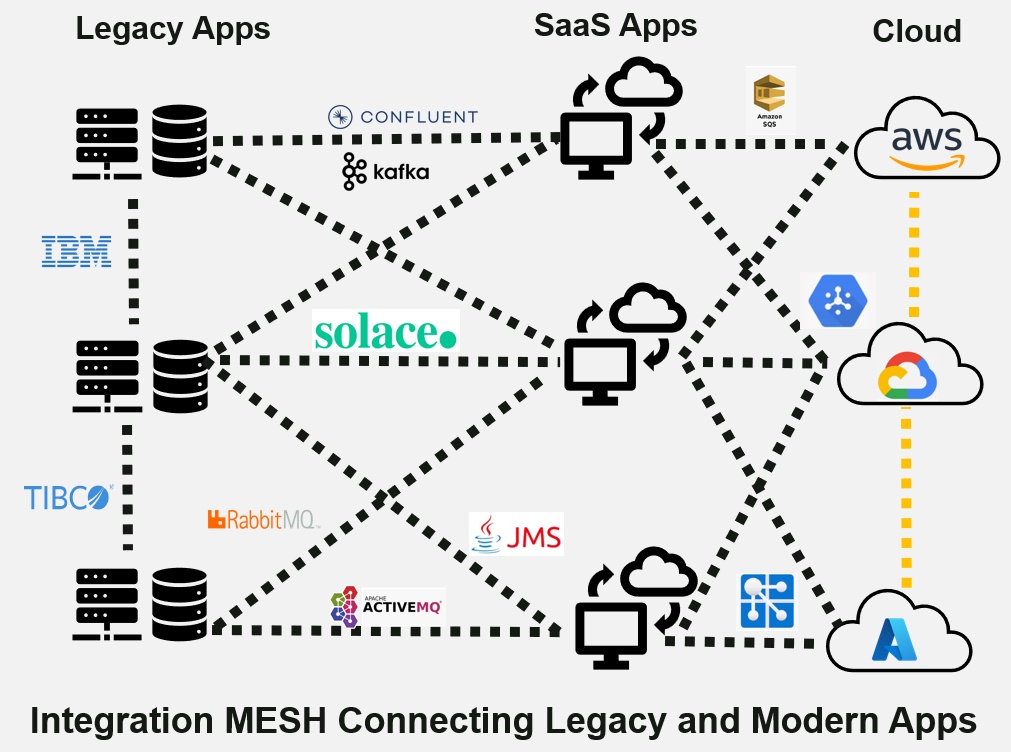
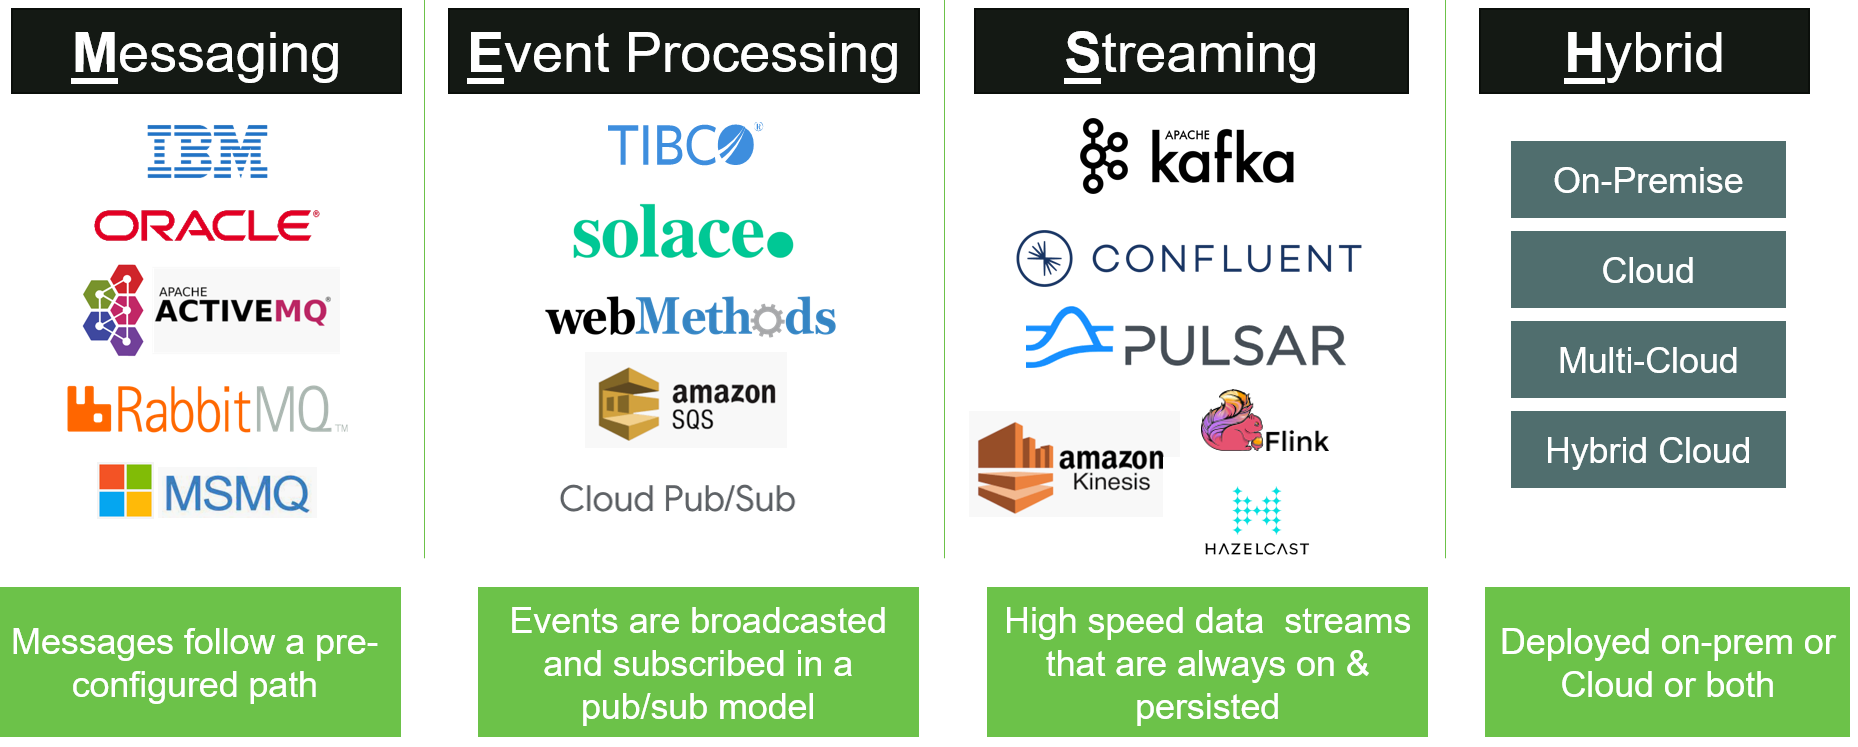
One company attempting to tackle today’s integration challenges, meshIQ, has coined a new acronym to break down the integration pattern. In this case, it’s not another service mesh—MESH stands for “Messaging, Event processing, and Streaming, across Hybrid cloud.”
Separately, each letter in the MESH represents a broad technology category. The plan is to bring together a flexible solution to integrate distributed and decentralized technologies. MESH in this sense is just as much a thing you do, as a particular solution you would buy, because it changes the relationships of DevOps, architecture, and operations teams to the integration process.
New stakeholders for integration work with MESH
Gone are the days of throwing adaptation requirements and service tickets ‘over the wall’ to someone else.
Today, the old organizational silo of an integration team is giving way to a platform engineering function. Platform engineering is done by a federated team, perhaps drawn from a council of other stakeholder departments, combining solutions from selected vendors to provide developers, architects and other roles with the self-service tools they need to do development, deployment, and integration themselves, with minimal support or intrusion.
The advantage of providing a MESH for platform engineering is immediately obvious to any teams that previously had to wait for provisioning budget reviews and change control boards. We want to distribute integration work, and observability into the state of integration, down to new stakeholders in order to deliver new functionality faster, and respond to problems with faster remediation.
In this story, we’ll discuss five unique new stakeholders for MESH that benefit from this sea-change in integration roles and responsibilities.
Shared Services / Platform Teams
Shared Services groups are the most likely owners of the platform engineering initiative. Often, this group inherits some of the workload left behind by the departure of the old centralized middleware integration team, with a notable exception. Rather than acting as a ‘service bureau’ for others, they lay the self-service infrastructure foundations for application delivery and operations tooling to serve other employee groups.
Primary considerations: Control and Governance
Since shared services is still responsible for the ongoing support of both legacy middleware integration layers and newer API and event-driven hybrid cloud architectures, they are looking to MESH to gain a single point of control over all middleware, investigate problems, and make changes to objects such as repairing a message queue or event bus when needed.
Shared Services manages the inventory of the integration architecture used for platform engineering activities, ensuring that all of the assets in play and connections are holding up under the workloads of other constituent teams, and updating or retiring assets when needed.
Enterprise Architects
Enterprise Architects (or EAs) view integration from a high level, but they also need to dig into the details. For any new project, they will establish a starting data schema or communication format, then visit the MESH to decide on group permissions, and set the standards for ongoing integration projects across the enterprise. Importantly, the perspectives of EAs should prevent technology sprawl and eliminate redundant or dead-end components as underlying cloud technologies keep changing.
Key considerations: Standardization and Consistency
EAs are always seeking higher levels of automation and reproducibility for Infrastructure-as-Code (IaC) recipes and scripts such as Ansible playbooks, which define the desired to-be state of each next release in relation to the integration standards they specify. In these situations, the MESH normalizes API interfaces across multiple clouds, middleware stacks and data services, so underlying application development teams can deliver their own part with consistency, without excessive redefinition or customization.
Application Owners
Application Owners may come from either development, or the sales or marketing side of the business. These individuals often own the P&L (profit & loss) responsibility for an application, gathering market demand signals and customer requirements while advancing the feature roadmap and ensuring that the application meets customer and regulatory demands. The scope, revenue targets and budget of the product influences integration choices.
Key Considerations: Auditability and Change Awareness
As software becomes more distributed and granularized into microservices, the number of service connections and API calls that comprise an application increases exponentially. The Application Owner would use MESH observability to keep track of all configuration changes made by developers and admins for every object within their customized application domain view.
Using this method, they can generate a full audit trail of all changes: who executed them and when, how they contribute to the completion of each targeted feature, and the relative success metrics and integration risk of each change on the production system.
Application Developers
Application Developers have a strong need to provision their own dev and test environments, so they can be agile and productive without provisioning bottlenecks, and deliver new functionality without worrying about the timing of production change windows.
Key considerations: Self-service provisioning and flexibility
Every bit of workflow code a developer writes for modern systems is highly dependent on component-level integration and messaging layers, therefore they need ready and functionally complete self-service environments for testing and promotion.
Developers want the permissions and empowerment to move forward using a MESH to create and consume REST-style or real-time async APIs on middleware objects, without having to wait for environment provisioning bottlenecks or lengthy change request/review cycles. A tightly granular set of access privileges to groups of objects allows them to safely work within their own application feature.
Devs can check in code without impacting the dependencies of adjacent development teams or the production system at large, while architects and managers can maintain control through system-wide monitoring and standardization of the integration object library.
Application Support
Application Support takes many different forms in an organization. There are customer-facing support teams that can resolve simple user error problems, while taking in feedback and error reports. Employee support can assist platform engineering with a help desk function that provides educational resources and keeps productivity high for all constituents of the MESH. Operations support teams need production monitoring and deeper observability into the root causes of failures and performance problems.
Key Considerations: Real-time Insight and Policy Management
Maintaining high service level objectives (SLOs) for any application stack only happens with complete real-time monitoring, early awareness and alerting of issues. Given the complexity of underlying integrations, the MESH needs to provide machine-learning based filtering routines for runtime metrics and event data that is coming in too fast for a human to process.
To stay ahead of the rate of change and focus on what is significant, support teams can group together and classify analytics and targeted searches of source data in the MESH event catalog, and create monitoring policies that address the most likely risk factors for system instability, performance hits and potential security exploits. When a high-priority alert is received, support teams can then turn over the issue to the owner of the affected application domain or integration object, with an incident report for faster remediation.
The Intellyx Take
Organizations that are seeking to close the chapter of dedicated integration teams, and the inflexibly rigid provisioning and change management standards that accompanied them, should consider moving toward a modern integration MESH platform approach like meshIQ.
As the future of enterprise software integration will only become more distributed and fragmented across hybrid cloud resources, APIs and data services, so should our stakeholder roles and responsibilities change to meet the challenges of increased complexity in deployment.
©2023 Intellyx LLC. Intellyx is editorially responsible for this document. No AI bots were used to write this content. At the time of writing, meshIQ is an Intellyx customer. Image sources: TBA; Screenshot: meshIQ dashboard (optional)
Distributed transaction tracing (DTT) is a way of following the progress of message requests as they permeate through distributed cloud environments. Tracing the transactions as they make their way through many different layers of the application stack, such as from Kafka to ActiveMQ to MQ or any similar platform, is achieved by tagging the message request with a unique identifier that allows it to be followed.
For ease of understanding, it is similar to using an Apple Airtag or any similar GPS tracker to keep an eye on the progress of your luggage at the airport. This enables you to understand where it is at any particular point and observe the progress in real-time. Distributed transaction tracing is indispensable if clarity and observability are essential to you and your business.
Transaction tracing is crucial in today’s increasingly complex business landscape, where companies depend on numerous interconnected systems for operations and decision-making. It helps firms identify and resolve issues faster, improving performance, reliability, and customer satisfaction. However, with the shift from hybrid or standalone systems towards distributed, cloud-based architectures, tracing transactions across different systems and components is becoming much more challenging. We will explore how Integration MESH can deliver distributed transaction tracing capabilities, enabling companies to gain complete visibility into their middleware systems.
What is MESH?
MESH is an acronym for Messaging, Event Processing, and Streaming Across Hybrid Cloud. This is more than just middleware. It is an evolution beyond that and has become the nervous system that controls the entirety of the digital enterprise, whether on-site, hybrid or cloud. MESH has evolved from messaging to event processing to data streaming. These all still exist and have to be managed interoperably across the wide gamut of on-site, hybrid and cloud solutions deployed by businesses worldwide. This is where MESH comes into play.
An Integration MESH is a network of interconnected services and APIs facilitating communication between applications or microservices. It enables the components of a distributed system to interact as seamlessly as possible. It provides a distributed architecture that allows the business to scale and evolve faster.
What is Distributed Transaction Tracing?
Distributed transaction tracing (DTT) tracks a transaction from start to finish across multiple services and APIs. It helps to analyze the system’s performance as a whole rather than on a component-by-component basis. DTT provides visibility into transaction flows, which, in turn, helps identify issues that can cause slow performance or system crashes.
You can follow a single event throughout its journey, as it travels through the application stack such as Kafka to ActiveMQ to MQ or any similar platform, and get a holistic view of the message flow from the beginning to its destination. This can often be delivered using the OpenTelemetry standard in conjunction with the meshIQ platform.
Real-Time Insights
One key feature of Integration MESH that enables distributed transaction tracing is its ability to provide real-time insights into transactions. It does this by leveraging different protocols and technologies to capture and combine transaction data from disparate sources. This way, companies can get an accurate and up-to-date view of transaction flows and statuses across different systems. Furthermore, this capability extends beyond simple visibility to transaction monitoring, analysis, and management.
Centralized Governance and Control
Integration MESH also enables distributed transaction tracing by providing centralized management and control. This is made possible by the platform’s ability to manage integrations from a central location, with granular visibility and control over individual transactions as they flow from Kafka to ActiveMQ to MQ or any similar platform. This way, companies can identify issues quickly, pinpoint the root cause, and resolve them promptly. Furthermore, this centralized approach offers better security, compliance, and governance, by managing data privacy and access across different systems.
How can meshIQ help deliver DTT?
meshIQ provides a data-driven approach to Distributed Transaction Tracing that is flexible and scalable enough to meet the demands of even the largest and most complex IT ecosystems. The meshIQ analytics engine collects transaction data from various sources, including logs, metrics, and traces, and uses it to identify patterns and anomalies across different services. The detailed dashboards and visualizations generate alerts and notifications that help DevOps teams to address problems before they escalate.
Benefits of using meshIQ for DTT
1) Enhanced visibility: meshIQ’s detailed dashboards and visualizations provide a complete view of the transaction, reducing the time to identify and fix issues. The single pane of glass solution allows you to observe the entirety of the message journey throughout the diverse systems that comprise the ecosystem.
For many businesses, their message journeys are basically inside a black box that they are unable to see inside, and meshIQ is a market leader in the realm of observability.
2) Improved governance and collaboration: meshIQ fosters collaboration between teams through unique role-based access controls, which gives each team member the right level of access to the data they need. This guarantees that the correct permissions are assigned to those who need them and ensures good governance.
3) Automatic correlation and analytics: meshIQ’s analytics engine automatically correlates transaction data from multiple sources, which speeds up troubleshooting and problem-solving. Pattern matching and machine learning can come into play to help identify potential problems or anomalies before they arise.
4) Scalable and flexible: meshIQ’s data-driven approach to distributed transaction tracing is robust, scalable, and can handle the largest and most complex IT ecosystems. There is such a wide variety of software that is being used in the middleware messaging space, and much of it is older, legacy software. The scalability and flexibility offered by meshIQ allows for reliable integration across the diverse range of available software solutions.
Conclusion:
In conclusion, distributed transaction tracing is critical for companies looking to improve their system performance, reliability, and customer satisfaction. MESH is a platform that can deliver these capabilities by providing end-to-end visibility, standardization, centralized management, and a high degree of control. Moreover, the platform’s ability to connect different systems and applications across complex and distributed architectures offers companies a holistic approach to integration and transaction management.
Join us for our biweekly TechTalk Tuesday series to learn more about our platform or contact us to find more.
In today’s rapidly evolving technological and business landscapes, staying competitive requires more than just a great product or service. It demands a technological edge that can drive efficiency, innovation, and overall growth. This is where partnering comes into play – it’s like turbocharging your business engine. Today, meshIQ is looking to turbocharge our sales teams, processes, and reach by adding power via partnerships.
Unleashing Technological Horsepower
Like a turbocharger dramatically enhances an engine’s performance, partnering with Resellers and Services partners can rapidly scale our business operations. These tech-savvy collaborators bring in-depth expertise, cutting-edge technology, and a fresh perspective to the table. This boost of digital power will drive our business to new heights.
1. Expertise Injection
Resellers and System Integrators are masters of their craft. Their teams consist of skilled professionals who specialize in various areas of selling software and everything from design to support and project management. By partnering with them, we are aiming to tap into a wealth of knowledge that would be challenging, costly, and above all time-consuming to develop in-house.
2. Accelerated Innovation
In the same way that a turbocharger boosts an engine’s horsepower, a Partner can propel our business forward. They’re immersed in the latest industry trends, ensuring that mutual business stays relevant and adaptive. Their innovative solutions can catalyze new product development, streamline processes, and even open doors to entirely new markets and prospects.
3. Enhanced Efficiency
Just as a turbocharged engine optimizes fuel consumption, a Partner has the potential to streamline our business processes. By augmenting services and sales, their extended teams can save time, and scale our sales and complement our services teams.
4. Flexibility and Scalability
Turbochargers provide an extra boost when needed, and so do Partners. They offer flexible solutions that can be tailored to our customers’ unique needs. Plus, as the business expands, their sales reps and engineers can effortlessly accommodate increased demands, ensuring a smooth growth trajectory.
5. Cost-Effectiveness
While turbocharged engines may consume more fuel, partnering with a Reseller or System Integrator can actually save costs in the long run. Investing in partnerships fosters customer trust, reduces operational inefficiencies, and leads to new sales opportunities. The return on investment becomes evident as our business becomes leaner, more efficient, and more profitable.
6. Focus on Core Competencies
Just as a turbocharged engine specializes in generating power, meshIQ needs to add power to our existing sales teams. By delegating the complexities of selling and services to external experts, we can concentrate on prospecting and product development. This division of labor fosters a more streamlined and productive operation.
Final Thoughts
The rapid acceleration in innovation, efficiency, and sales growth potential can be a game-changer. As we consider our company’s future, we are mindful of how powerful partnerships can be the key to outpacing the competition and reaching new heights.
So, why wait? Buckle up and prepare for the ride of being a premier Partner of meshIQ. Just as a turbocharged engine transforms an ordinary vehicle into a high-performance machine, your partnership with Us could revolutionize customer outcomes.
Remember, every successful partnership begins with a conversation. Reach out to us and let’s explore the capabilities and how we can fuel our customer’s journey into the fast lane of success.
Most companies in today’s business landscape that deal with large amounts of data want to integrate their applications so that they can pass data between them seamlessly and easily. Being able to ensure that you can see exactly what is happening at every stage of the process is key, and this is where approaching the process with observability in mind can make a real difference.
Deciding at the outset that observability is something that you want to be baked into the process means that you can plan and execute with that in mind. One of the easiest ways to do this is to use meshIQ, which is an observability platform for Messaging, Event Processing, and Streaming Across Hybrid Cloud (MESH).
What Kind of Applications Need Integration?
An excellent example of the kinds of applications that need integration to work together is e-commerce platforms which need to connect to customer relationship management applications, stock management and order fulfilment applications. These can all require there to be fluid movement of data between the different databases that hold the relevant information at each step of the process.
There are different types of application integration, and at their most basic level, some of these can be point-to-point, where integration is established directly between two different applications in order that they are able to communicate with each other. In cases such as this, there are numerous problems, and these include a lack of scalability and resistance to change. If you need to hand code every new integration, the deployment and testing times for any upgrades can prove to be inefficient in the extreme and unsustainable in the longer term.
A slightly more advanced way of allowing integrations is to incorporate hub and spoke or enterprise bus architectures. Both are now considered to be legacy systems. Still, the idea behind them was that it was easy to add another integration to the system as it just needed to connect to one spoke of the “wheel” to integrate with all the other applications that were already integrated. These architectures tend to be described as middleware solutions, and they are typically deployed in on-premises solutions, which is a large part of why they are considered legacy systems today, as cloud-based systems have become the norm.
With this shift en-masse to the cloud, what we are seeing is a migration to Integration Platform as a Service (iPaaS) which is the modern method of integrating application solutions which includes an impressive array of additional features, including complete cloud-based data integration, data management functions and easy connections to APIs. These systems are set up to be able to offer immense versatility in what they can integrate, encompassing on-premises applications as well as those which are cloud-based.
The beauty of using a cloud-based system such as meshIQ is that it is a streamlined process which accounts for and tracks all the data throughput of the system and can locate individual pieces of data within the system with a high degree of accuracy.
Why Do We Need Application Integration?
Application integration is important to ensure that data redundancy isn’t taking up excessive storage space and slowing down the system. It also ensures that there is no confusion generated by having multiple copies of the same data and it not being clear which should take precedence. In essence, different applications can create their own data silos when this happens, which defeats the whole idea and purpose of integration between them. Data inconsistencies can cause problems further down the line and can require human intervention to rectify any problems that occur.
Increased Productivity
Being freed from the chore of having to create point-to-point connections between different applications will allow your employees to use their time more productively to further the aims of your business, using the information gleaned from your data.
Easy Scalability
The APIs and connectors that are available to be utilized can make it so much easier to scale up solutions and add connections where needed without having to create bespoke connections by hand.
Cost-Effectiveness
This is one of the critical considerations in any business, and yours is no different. The savings in terms of efficiency make modern ways of application integration a necessity in the current economic climate. To run a successful business, they are simply a must.
Why is Observability so Important?
Observability is vital so that you can see exactly what is going on throughout your system at any given moment. Being able to accurately track and trace data wherever it happens to be in your platform is necessary to safeguard the viability of your business. Knowing the status of your data at any given moment is made easier through the building in of observability solutions from the ground up.
This is where meshIQ comes in. meshIQ’s proprietary application integration solutions allow a single pane of glass observability solution that can pinpoint everything that is happening in the system and can allow you to shine a light into the inner workings of your system, finding the cause of Irregular Operations (IROPS) and reducing the Mean Time to Repair (MTTR) significantly in the process.
Many solutions treat observability as an afterthought, but it is treated as a top priority by meshIQ because it is understood that time is money and that if your system is down, then you are losing money that whole time. With some other systems, looking for where there is an outage can be like looking for a needle in a haystack but with the observability that is built in with meshIQ, you can immediately pinpoint where the problem is and take steps to rectify it.
You can even set rules so that if the same problem occurs in the future, it is automatically dealt with in a particular way, which can actually mean that it is never such a significant problem in the future as it is automatically dealt with.
Join us for our biweekly TechTalk Tuesday series to learn more about our platform or contact us to find more.
When businesses look at how best to understand the performance levels of their platforms, some of the best incident management metrics to look at are Mean Time Between Failures (MTBF) and Mean Time To Resolution (MTTR). These two measurements will give an excellent indication of the health and speed of the system, as well as the ability of the platform to take care of any anomalies that have been detected or to flag them up for others to take action to resolve them.
By understanding these measurements, it is possible to gain a better insight into how reliable and responsive their platform is. Additionally, they can help identify any weak points in the system or areas where issues may need to be addressed quickly. With this knowledge, companies can then take all appropriate action to ensure that their platforms continue running at optimal levels with minimal disruption.
Fine grained observability of your system will obviously make it easier to pinpoint exactly where some of the problems are taking place and help reduce the amount of time that it takes to respond to any incidents. We will take a closer look at how meshIQ delivers fine grained observability to do this shortly.
Mean Time Between Failures – MTBF
Mean Time Between Failures is a measure of reliability that logs the uptime that the system has experienced between failure events. It is a rolling mean that is calculated every time there is another failure so that it is possible to log this and use it as a metric to say whether the platform is trending toward better or worse MTBF.
This can be a useful way of evaluating any changes that have been made because the historical record of the MTBF can be reviewed in the light of any changes made to the platform. If instability has been introduced at any stage then it will be obvious at which point this happened because of the negative change that it will make to the MTBF figures.
Mean Time Between Failures (MTBF) is a key indicator of the reliability of a system, and it can be used to identify potential problem areas that needs improvement. By understanding MTBF, organizations can make informed decisions about how best to improve their systems’ performance and uptime.
It also provides an indication of how well components are performing in comparison to each other, as well as providing useful insights into the overall health of the system. With this information at hand, teams can develop strategies for reducing downtime and increasing system efficiency.
How to Calculate MTBF
The value of the MTBF can be determined by multiplying the operating time of a repairable machine or apparatus by the number of failure observations in a specific time period. Calculations can be made using multiple failures related to products or failures related to multiple products. The time of the failure is the total hour of operation and the total failure. Total operational time is the total period of an application product that was not incidental during the time you are looking at analyzing. Total failure of the product is the total failed product in a given period.
The Importance and Usefulness of Mean Time To Resolution
MTTR helps organizations detect and eliminate inefficiency, which results in increased downtime and therefore poor productivity and loss of profits. MTTR is used by business owners to analyze and implement their strategy, and calculate how long it takes for systems to be fully operational again.
It is important to the company’s bottom line to figure out how to take action that eliminates or vastly reduces the downtime associated with Irregular Operations (IROPS). Getting the system back up and running and on an even keel after an incident is a matter of priority as any unplanned downtime can cost both money and client confidence.
What is the difference between MTTR and MTBF?
MTBF is an indicator of the rate of breakdown. After a breakdown, the MTTR describes what can occur immediately. Although the data may vary, they can be used together in analyzing systems uptime. The most beneficial result will be the steady decrease in MTTR and increase in MTBF, and describes a system with minimal downtime and the ability to rapidly recuperate if something happened at all.
MTBF and MTTR are two measurements used to analyze the reliability of a system. The Mean Time Between Failure (MTBF) is an indicator of how long a system can be expected to run without any major problems or breakdowns happening. The Mean Time To Resolution (MTTR) measures the speed that the system can be restored after a failure or breakdown has occurred.
By combining these two metrics, businesses can get an understanding of their systems’ uptime and determine what areas need improvement in order to increase efficiency and reduce downtime.
How Can Increased Observability Improve MTTR and MTBF?
meshIQ is an observability platform that has been designed from the ground up in order to offer increased visibility into complex integration middleware infrastructure namely Messaging, Event Processing, and Streaming platforms deployed across Hybrid Cloud (MESH) platforms and allow for 360-degree situational awareness.
The capabilities inherent in the meshIQ system mean that unlike other methods that offer observability solutions for MESH platforms, they can pinpoint where any points of failure occur far more accurately. A good analogy would be that of a sports stadium. Some of the most similar offerings would be able to spot where there was an irregular operation and trace it to a section of stadium seating, whereas meshIQ would be able to pinpoint the actual seat.
In order to rectify any problem, you have to know what is happening and where in the system it is located before taking remedial action. The high quality, single pane of glass observability offered by meshIQ means that they can find the point of failure far more quickly and also monitor the platform constantly for any signs of decreased performance, therefore improving both the Mean Time to Recovery and Mean Time Between Failures across the full stack and the entirety of the distributed platform.
In a nutshell
- Majority of the application problems stem from the underlying middleware layer whether it’s a slowdown or an outage. meshIQ detects them quickly and prevents an outage.
- Incorrect configurations can cause problems when a new build is deployed, meshIQ enables quick rollback across the whole middleware stack.
- meshIQ supports all major middleware platfiorms. Which means it can find that ‘needle in the haystack’ problem navigating the maze of middleware connections.
Ultimately, using meshIQ technology allows for teams to utilize their processes and procedures in an automated way to significantly reduce the MTBF and MTTR within their organizations.
Join us for our biweekly TechTalk Tuesday series to learn more about our platform or contact us to find more.
The last decade has been nothing but a roller coaster ride for the airline industry. The pandemic has transformed it forever and now it needs to reevaluate its digital transformation priorities on how to manage traveler expectations. Taking it a step further, travelers buying behavior is changing farther as now they will want to book tickets while chatting with an AI interface.
The transformation was already underway. In 2020, Google Cloud and Sabre announced a partnership to modernize Sabre. Recently, American Airlines announced their modern rebooking app launched in partnership with IBM. Lufthansa announced industry’s first continuous pricing tailored to suit individual customer attributes.
Key goals from the Digital Transformation initiatives:
- Revenue Optimization
- Pricing/Dynamic Pricing
- Enhanced Customer Experience & Engagement
- Fleet modernization and Emissions reduction
To achieve these goals, airlines are already making investments and are expected to make significant investment in their IT infrastructure over the next few years as they recover from the pandemic and adopt newer technologies.
According to a recent airline industry insights report, IT investment reached $37B in 2022. The top three areas that airlines plan to bolster with IT development over the next few years include:
Cloud Computing – Scalability is a major issue for many airlines. From the customer facing website to internal apps, everything comes under strain during peak season and any delay due to weather etc. can cause an expensive meltdown. Scaling automatically using Cloud based infrastructure can lead to much smoother experience for airline staff and passengers.
Security – Safeguarding passenger and flight data is paramount along with the safety of the flight. With the tremendous risks posed by state-backed and private hacker groups around the world, it is crucial for airlines to invest in data security to safeguard stored data and enable secure integration with other airlines and government agencies.
Modernize Apps – As customer expectations evolve, Airlines have no option but to modernize their apps, providing features and enhancements that improve customer experience and loyalty.
All this is only achieved via modernization. Many of the systems used by airlines today are decades old and completely outdated. Airlines will continue to make investments into their IT landscapes to bring the technology used in the aviation industry up to the modern standards that are expected of businesses today and deliver more AI, facial recognition, Cloud based apps. All these modern applications also require modern Event driven architectures connecting these applications for better scalability and reliability.
Modern apps need better Observability
The older observability tools do not work for a few reasons.
- The new Hybrid infrastructures where a combination new Cloud based apps work with older Mainframe/legacy apps, has a lot more components that needs to be monitored. The legacy monitoring cannot effectively monitor these components especially the Integration infrastructure gluing these apps.
- Legacy observability platforms are not geared to monitor Cloud and Hybrid apps. They cannot be deployed in Kubernetes and scaled along with the app. Some of them cannot even be deployed in the Cloud or do not have plugins to monitor newer cloud technologies.
- Lastly, there is the question of sampling, metrics and supporting modern tools such as Prometheus and Grafana. Legacy tools suffer from poor sampling rates and that increases the risk of outages as a delay of a few minutes can wreak havoc on application performance. Secondly, they may not fit into the modern observability vision.
Deliver Aviation excellence with meshIQ
At meshIQ, we specialize in monitoring Integration MESH and our observability platform is geared to monitor Messaging, Event Processing, Streaming infrastructures deployed across Hybrid cloud. We monitor mission critical MESH infrastructure that connects different aviation apps to each other over modern Integration patterns such as Event Driven Architectures. This results in higher reliability, and scalability of apps themselves reducing the risk of bottlenecks, slowdowns, and meltdowns during peak travel season.
Join us for our biweekly TechTalk Tuesday series to learn more about our platform or contact us to find more.